
My Projects
Financial Forecasting
Revenue forecasting using ARIMA and Prophet models.
Business Case
The objective was to develop a reliable forecasting model to predict future company revenue. This allows for better financial planning, resource allocation, and strategic decision-making.
Technical Details
This project involved time-series analysis using historical sales data.
- Data Source: Internal sales database (exported to CSV).
- Tools: Python, Pandas, Matplotlib.
- Models: Utilized both ARIMA and Facebook’s Prophet models to compare performance and accuracy.
Outcome
The Prophet model provided a forecast with a Mean Absolute Percentage Error (MAPE) of less than 8%, giving the finance department a confident baseline for the next two quarters. The results were visualized in an interactive dashboard.
Telecom Customer Churn Analysis
An end-to-end analysis of customer churn using Python to identify key drivers and inform retention strategies.
Business Case
Customer churn is a critical metric for subscription-based businesses like telecommunications companies. The goal of this project was to analyze a customer dataset to identify the primary factors that contribute to churn. By understanding why customers leave, the company can develop targeted retention strategies to reduce revenue loss and improve customer satisfaction.
Technical Details
This analysis was conducted using Python with the pandas library for data manipulation and Matplotlib/Seaborn for data visualization. The process involved several key steps:
- Data Cleaning: The raw data was loaded, and the
TotalChargescolumn was converted to a numeric type, handling missing values to ensure data integrity. The target variable,Churn, was encoded from ‘Yes’/’No’ to a binary format (1/0) for quantitative analysis. - Exploratory Data Analysis (EDA): I investigated the relationships between churn and various customer attributes. The analysis focused on how contract type, internet service, and monthly charges impacted the likelihood of a customer churning.
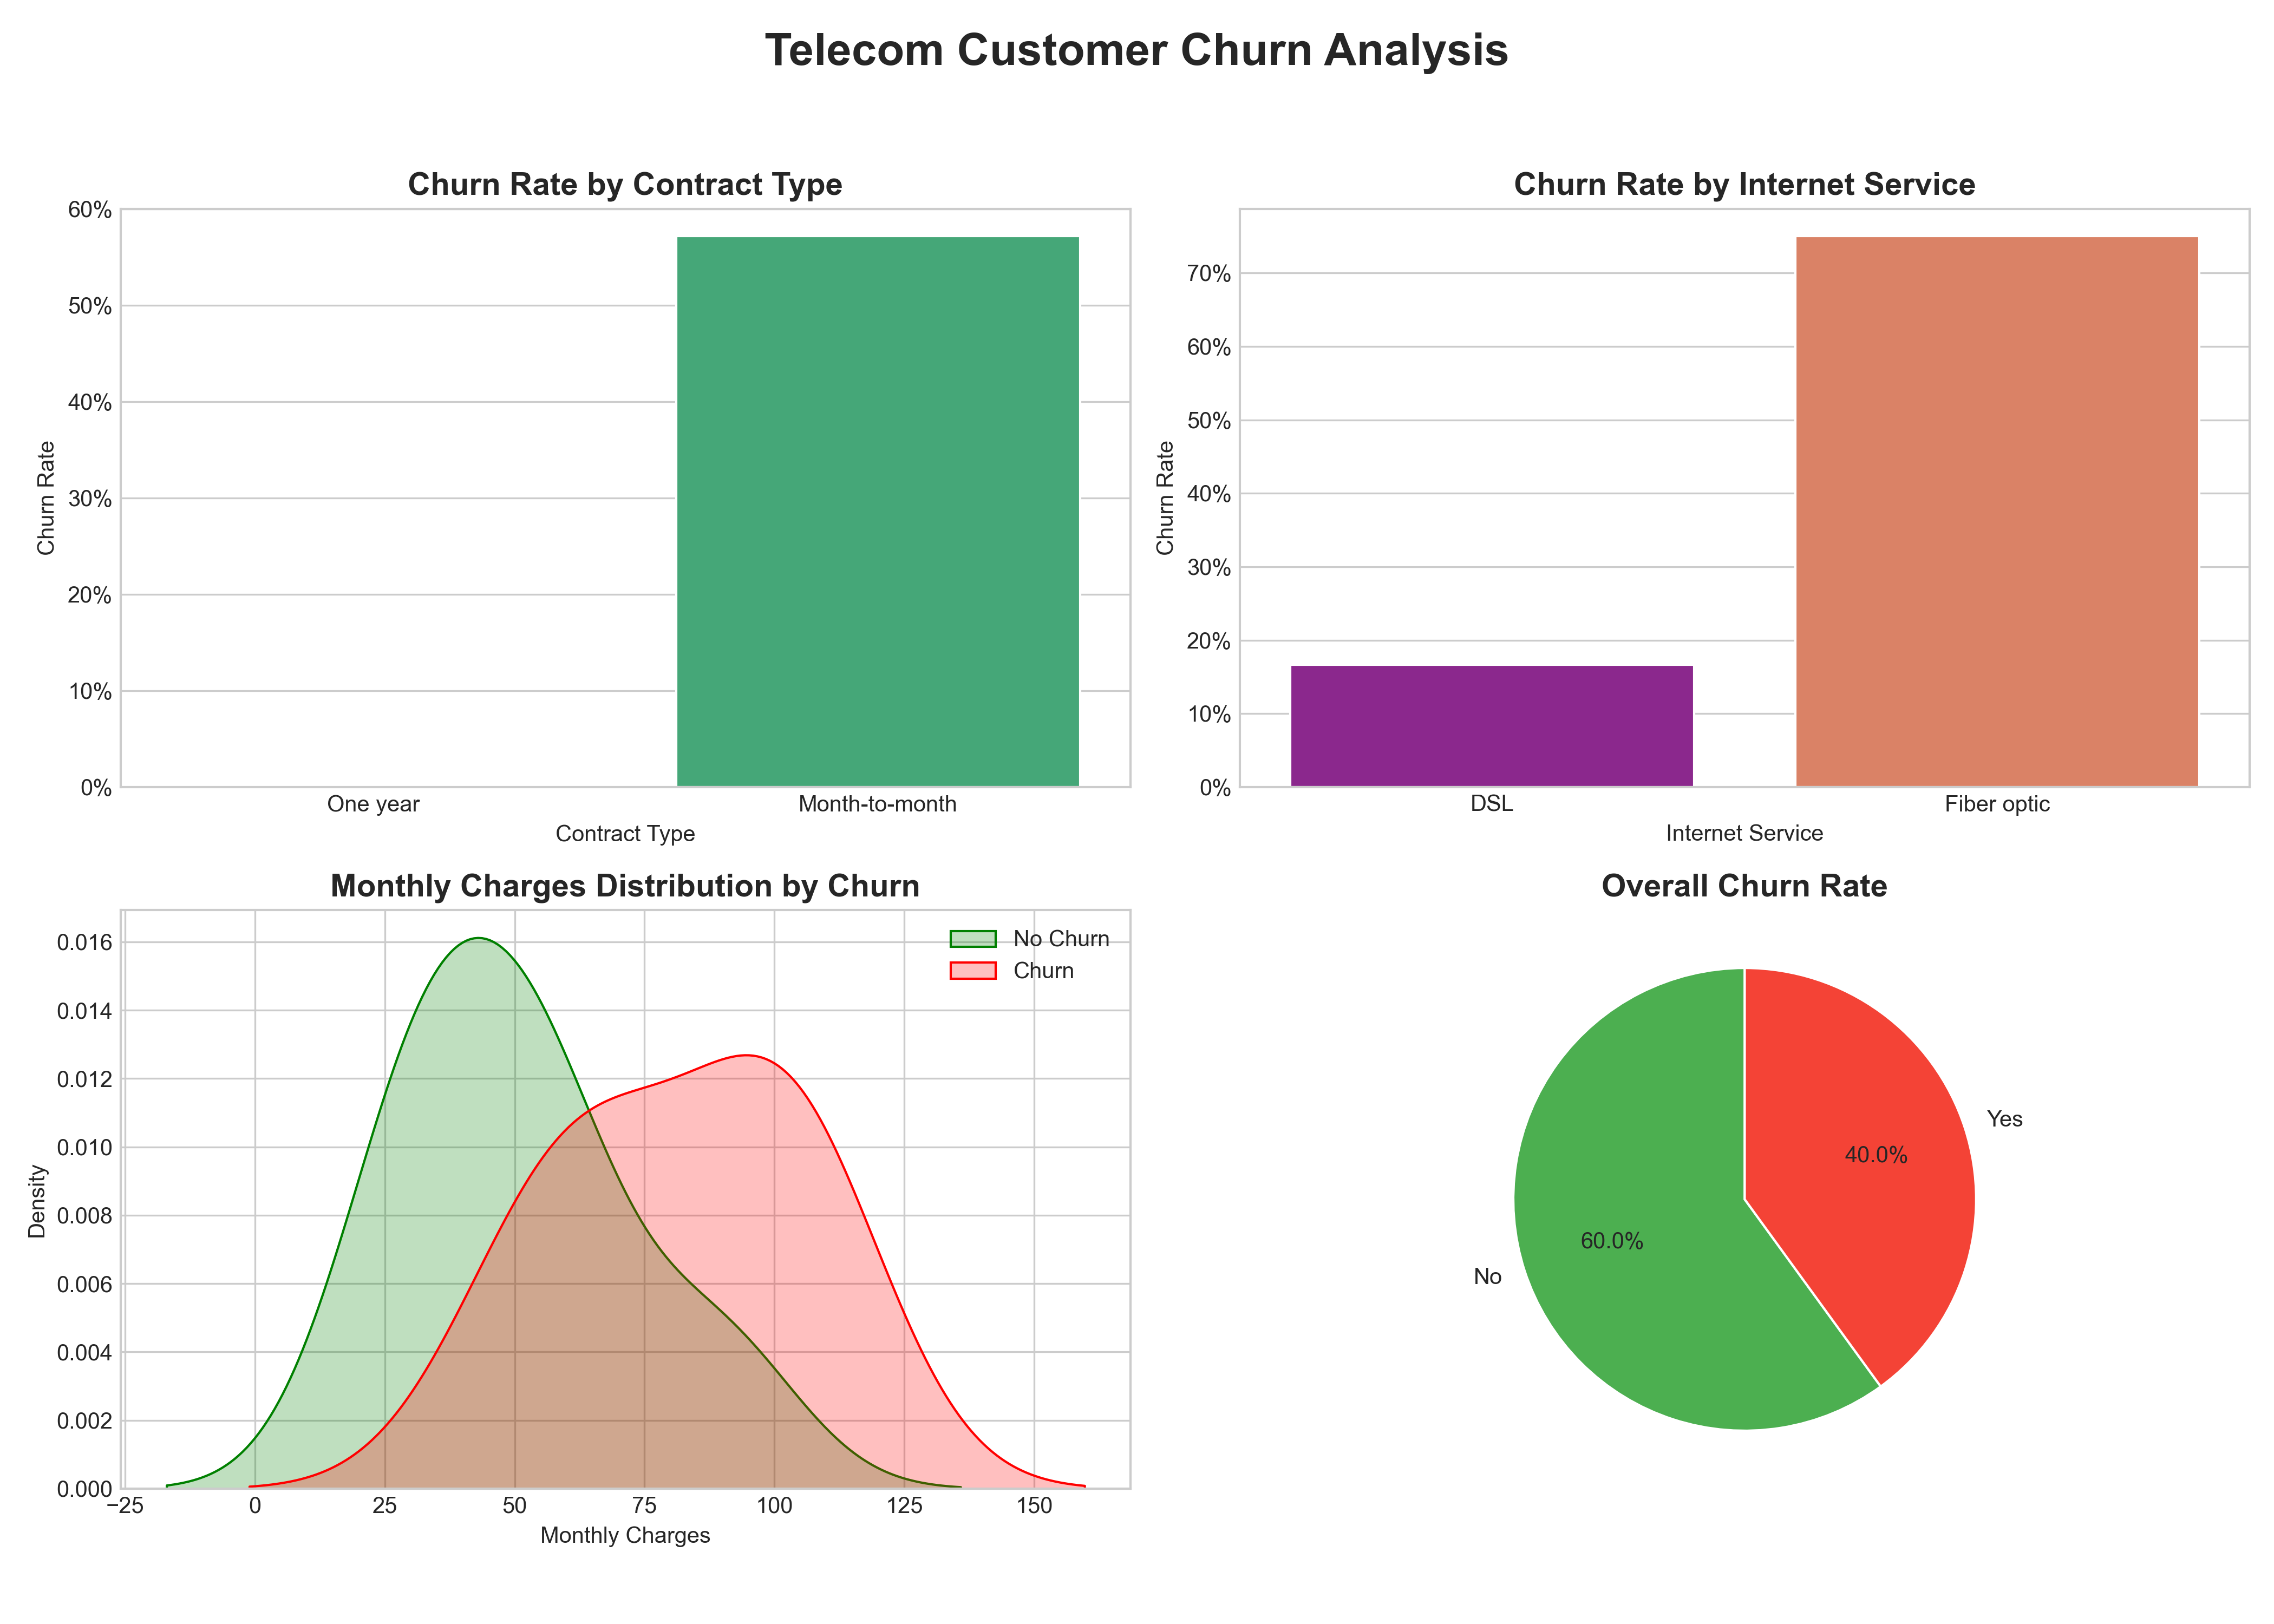
- Visualization: A comprehensive 2x2 dashboard was created to summarize the findings. This single visualization clearly communicates the churn rates by different segments and highlights the distribution of charges for churning vs. non-churning customers.
Outcome
The analysis revealed several actionable insights:
- Contract type is the strongest predictor of churn. Customers on a Month-to-Month contract have a significantly higher churn rate than those on One or Two-year contracts.
- Customers with Fiber optic internet service are more likely to churn than those with DSL, possibly due to higher costs or service instability.
- Higher monthly charges correlate with higher churn rates, especially for customers who are not on long-term contracts.
Based on these findings, I recommended a targeted retention campaign offering customers on Month-to-Month contracts a promotional discount to upgrade to a one-year plan, thereby stabilizing a key at-risk segment.
Interactive Churn Explorer
Below is an interactive Plotly chart that reads the site CSV and shows churn rate by contract type. Data loads client-side from assets/data/telecom_churn.csv.
Live Dashboards (External)
For richer interactivity (Streamlit, Spaces, Render), embed via iframe once deployed.
Interactive Churn Dashboard (Streamlit)
Live embedded Streamlit app. You can also open it in a new tab.
Forecast Dashboard
Embedded external dashboard. You can also open it in a new tab.